

The Real Problem: You are Spending Without Knowing where Returns Drop
A brand team increases rep calls in a key territory. Digital campaigns are also scaled to support the push. On paper, activity looks strong. The field teams are busy. Engagement metrics are healthy.
But prescriptions barely move.
No one can explain why.
The real issue is not lack of effort. It is lack of visibility into how channels behave at different levels of activity. Teams know what they are doing. They do not know when it stops working.
In practice, most promotional decisions are still based on averages, past performance, or broad ROI metrics. None of these show where diminishing returns begin. As a result, teams often over-invest in saturated channels and under-invest where incremental gains are still strong.
This is where Promotional Response Modelling becomes critical.
What PRM Actually Solves
Promotional Response Modelling quantifies how promotional activity drives prescribing behaviour across channels.
It answers three operational questions:
- How does response change as activity increases
- At what point does additional effort stop delivering meaningful returns
- What level of activity maximizes profit rather than just volume
PRM does not just measure impact. It shows how that impact evolves. That distinction is what makes it useful for decision-making.
In practice, this allows teams to move from static reporting to dynamic planning.
Why This Problem Exists in the First Place
Lack of Visibility Into Diminishing Returns
Most reporting systems show total impact. They do not show incremental impact. This hides the point where additional activity becomes inefficient.
Teams keep investing because the channel is still producing results, even if those results are declining per unit.
Channel Planning Happens in Silos
Rep activity, digital campaigns, and other channels are often planned independently. This ignores how channels interact in reality.
In practice, this leads to duplicated effort and message fatigue.
Over-Reliance on Historical Norms
Call plans and channel strategies are often based on what worked before. These norms rarely reflect current market dynamics or physician behavior.
This creates inertia. Teams continue investing in patterns that no longer deliver optimal returns.
The Business Impact of Getting It Wrong
The cost of poor promotional planning is not always visible immediately. It shows up over time.
- Budget is locked into low-efficiency channels
- High-value segments are under-engaged
- Sales growth plateaus despite increased activity
- Field force productivity declines
In practice, the biggest risk is not overspending. It is a misallocation. Even a small shift in activity across channels or segments can create meaningful gains, but without the right visibility, those shifts do not happen.
Understanding Response Curves
What a Response Curve Tells You
A response curve shows how prescribing behaviour changes as promotional activity increases.
- X-axis represents activity such as rep calls or impressions
- Y-axis represents incremental prescriptions or sales
The curve answers a simple question. What do you get if you do more?
Why Activity Matters More Than Spend
PRM models are built on activity, not budget.
Physicians respond to interactions. A rep call, an email, or a digital touchpoint drives behaviour. Spend is only a translation of that activity.
In practice, this ensures that decisions reflect execution reality. It also makes outputs easier to apply to field planning and channel strategies.
How Curve Shape Changes Decisions
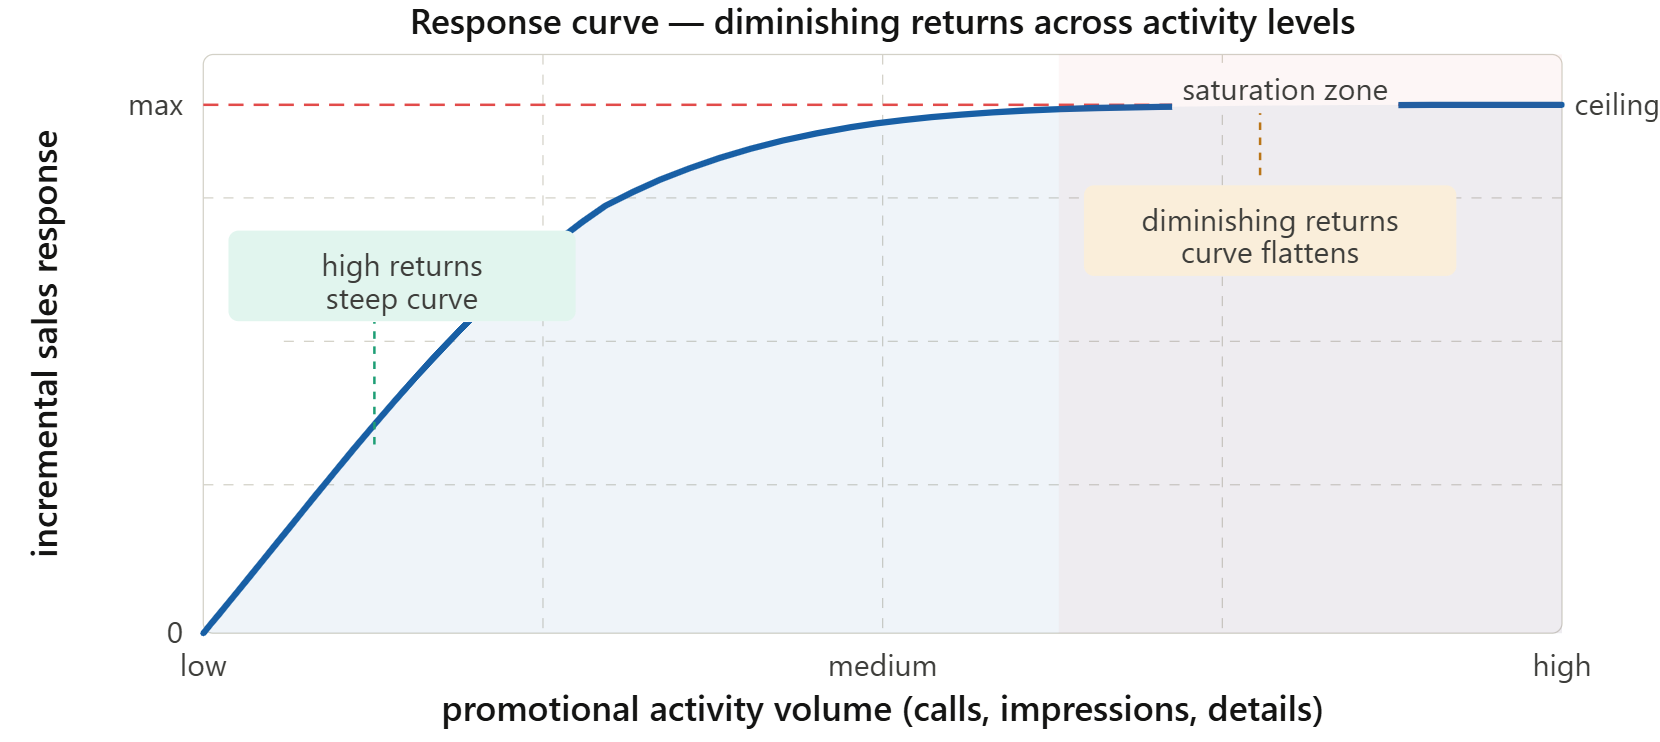
Negative Exponential: The Practical Default
This curve rises quickly at low activity levels and flattens as activity increases.
It reflects a simple reality. There is a limit to how much a physician can be influenced by a single channel.
In practice, this is the most reliable model for most promotional channels.
Log and Power Curves: Flexibility With Risk
These curves do not impose a hard ceiling. They continue to increase slowly as activity grows.
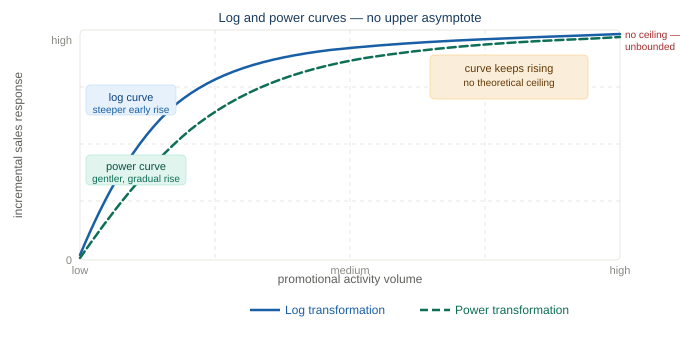
This can create misleading signals during optimization. The model may recommend high activity levels because it does not naturally cap returns.
In practice, these curves require careful constraints.
S-Curve: When Thresholds Matter
The S-curve introduces a minimum effective level.
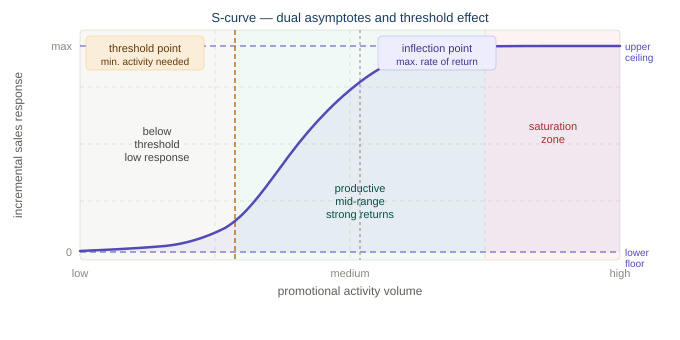
Below that level, activity has limited impact. Once crossed, response increases sharply before eventually flattening.
In practice, this is useful for channels that require repeated exposure before influencing behaviour.
Using MROI to Make Better Decisions
What MROI Actually Shows
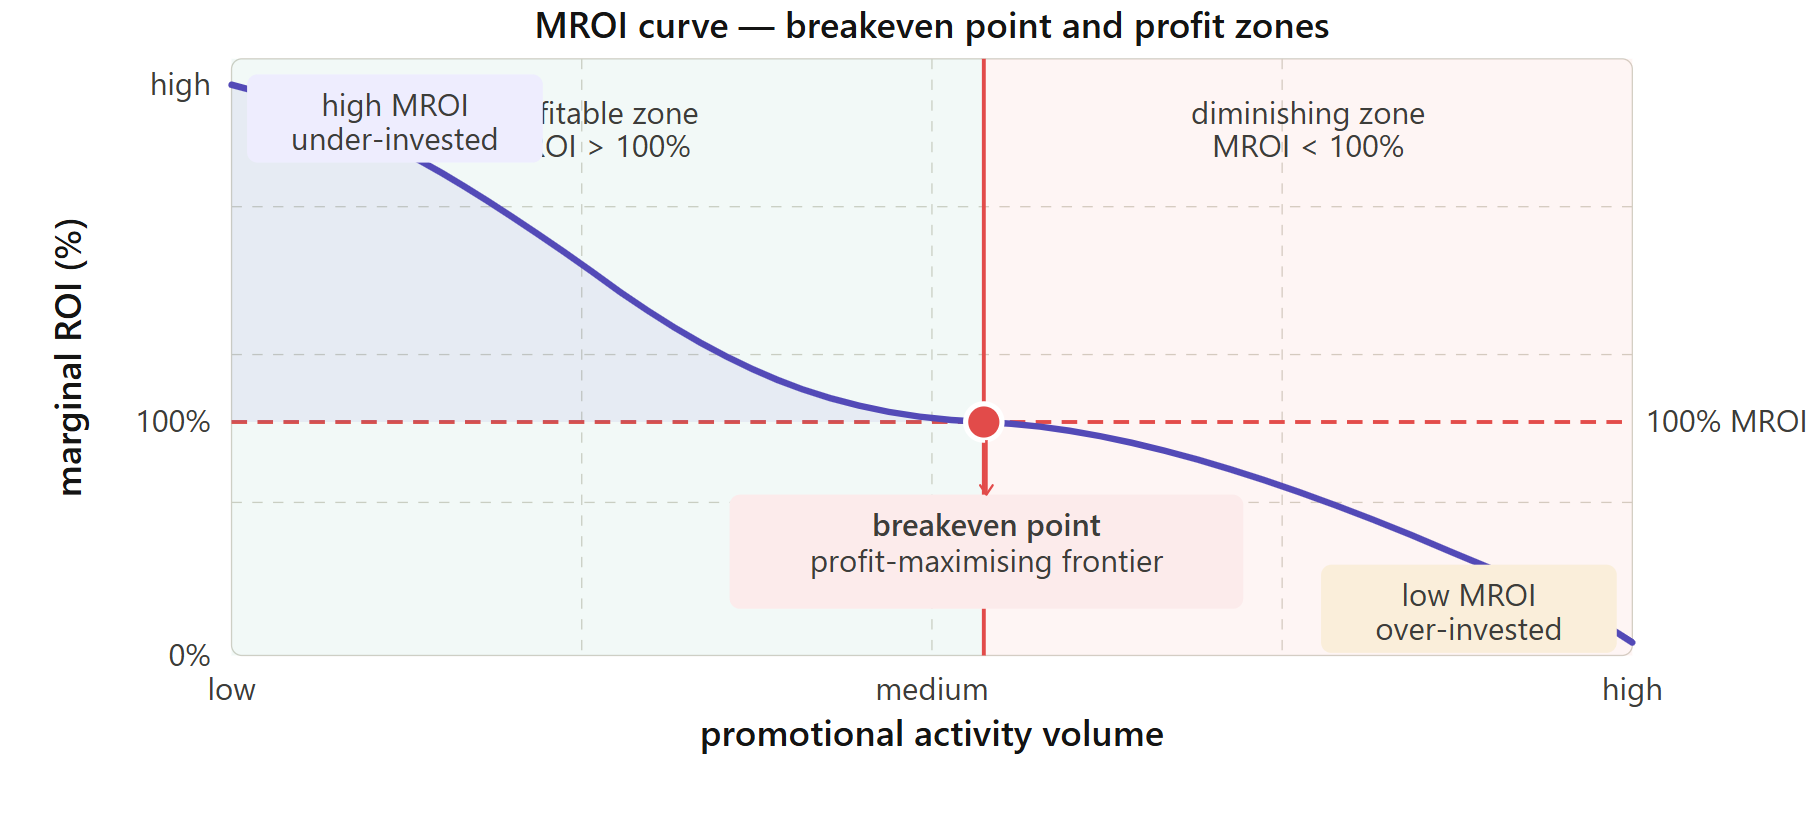
Marginal ROI measures the return from the next unit of activity.
- High MROI indicates under-investment
- Declining MROI indicates diminishing returns
- Low MROI indicates saturation
This is the most actionable output from PRM.
Why the 100 Percent MROI Point Matters
This point represents breakeven. The next unit of activity generates the same value as its cost.
Beyond this point, additional activity reduces profitability.
In practice, many teams ignore this signal. They continue investing because total returns are still positive, even if marginal returns are not.
Interaction Effects: Where Planning Breaks Down
Channels do not operate independently.
When Channels Work Together
A rep call followed by a digital message often performs better than either alone. The first interaction primes the physician. The second reinforces the message.
This is synergy.
When Channels Compete
Too many touchpoints across channels can overwhelm the same physician. Messages overlap. Attention drops.
This is cannibalization.
Why This Is Hard to Model
Interaction effects require variation in how channels are used together.
In practice, channels often scale together. This makes it difficult to isolate combined effects. As a result, interaction signals are often unstable or misleading.
The risk is clear. If interactions are misestimated, channel strategies become distorted.
Why PRM Fails in Real-World Execution
- Granularity Trade–offs
Response curves can be built at different levels of granularity, and the choice directly affects how useful they are for promotional planning.
- Per HCP level – captures individual prescriber behaviour with maximum fidelity but requires sufficient activity and Rx history per physician to produce stable, reliable curves
- HCP segment level – builds curves for groups of physicians sharing similar prescribing characteristics; the most practical balance between granularity and reliability for most pharma brands
- Aggregate brand level – easiest to construct but masks meaningful variation across physician types, deciles, and geographies – limiting the curves’ usefulness for targeted promotional decisions
Adstock Decisions
Adstock accounts for carryover effects from past promotional activity. When building response curves, there are two approaches:
- Without adstocking – response curves are built on raw activity data, reflecting only the in-period promotional input for each channel
- With adstocking – activity is transformed to account for carryover before the curve is built, meaning the curve reflects the accumulated promotional pressure on a physician over time rather than just the current period
The choice depends on the channel’s decay characteristics, the client’s objectives, and how carryover effects are being handled elsewhere in the model. In practice, incorrect assumptions about carryover can distort the curve shape – and every optimisation recommendation that follows.
Data Constraints
Channels often move together. This creates multicollinearity, making it difficult to isolate individual effects.
In practice, this leads to unstable models and unreliable insights.
From Analysis to Action: Where Value Is Created
Response curves are not the end goal. They are inputs to decision-making.
They feed into optimization models that simulate different scenarios and recommend the best allocation of effort.
The output is clear:
- How many calls to make
- Which segments to prioritize
- How to distribute effort across channels
In practice, the value comes from applying these insights consistently, not just generating them.
How Chryselys Can Help with Promotional Response Modelling
Most PRM work breaks after the analysis phase. Models are built, insights are shared, and then they are not used consistently.
Chryselys addresses this execution gap.
The platform makes response curves continuously available and usable. Models are refreshed as new data comes in, so insights stay relevant.
Commercial teams do not need to interpret complex outputs manually. They can directly ask:
- Is this channel over-invested
- Where should activity increase
- What happens if we shift effort across segments
This reduces dependency on analytics teams and speeds up decision cycles.
It also improves consistency. Decisions are based on current data, not outdated assumptions.
The result is better allocation, faster planning, and lower risk of wasted spend.
FAQs
1. How do you identify diminishing returns in pharma promotion?
Diminishing returns are identified by analyzing how incremental prescribing changes as promotional activity increases. In PRM, this is captured through response curves and marginal ROI. As activity grows, marginal gains begin to decline, indicating saturation. The point where incremental return drops significantly signals diminishing efficiency. In practice, this allows teams to stop investing in channels that still produce results but no longer justify additional spend.
2. What data is required to build a PRM model?
A robust PRM model requires detailed promotional activity data at the HCP * month level or aggregate, along with corresponding prescription or sales data. This includes rep call frequency, digital engagement metrics, and timing of interactions. External factors such as seasonality or market events may also be included. In practice, data consistency and variation across time are more important than volume, as they enable the model to isolate the impact of different channels.
3. How does PRM improve field force effectiveness?
PRM improves field force effectiveness by identifying optimal call frequency and targeting strategies. It shows where additional calls generate strong incremental returns and where saturation occurs. This allows teams to prioritize high-value segments and avoid over-servicing low-impact ones. In practice, this leads to better territory planning, improved productivity, and more efficient use of field resources.
4. When should interaction effects be included in PRM?
Interaction effects should be included when there is evidence that channels influence each other’s impact. This requires sufficient variation in how channels are deployed together. For example, rep calls followed by digital engagement may show measurable synergy. In practice, interaction terms should only be added when they are statistically stable and supported by clear behavioural logic, otherwise they can introduce noise into the model.
5. Why do PRM insights often fail to drive decisions?
PRM insights often fail because they are delivered as static reports rather than integrated into workflows. Teams struggle to interpret outputs, update models, or apply insights consistently. In practice, this leads to a gap between analysis and action. Without continuous access to updated models and clear decision support, even high-quality insights fail to influence day-to-day planning.